> ## Documentation Index
> Fetch the complete documentation index at: https://gcore.com/docs/llms.txt
> Use this file to discover all available pages before exploring further.
# Monitoring for load balancers
Load Balancers expose metrics and access logs through two mechanisms: a Prometheus listener that publishes a scrape endpoint, and Managed Logging that forwards listener access logs to OpenSearch. Both are configured per Load Balancer in the Customer Portal.
## Prometheus listener
A Prometheus listener exposes an endpoint with the Load Balancer's metrics for scraping with Prometheus and viewing with Grafana. Unlike regular balancing listeners, it does not route traffic — it only serves metrics.
Import [this pre-made Grafana dashboard](https://grafana.com/grafana/dashboards/15828-openstack-octavia-amphora-load-balancer/) to display the metrics.
### Enable Prometheus listener
In the **Cloud** menu, select **Networking** and then **Load Balancers**. Click the Load Balancer name to open its settings.
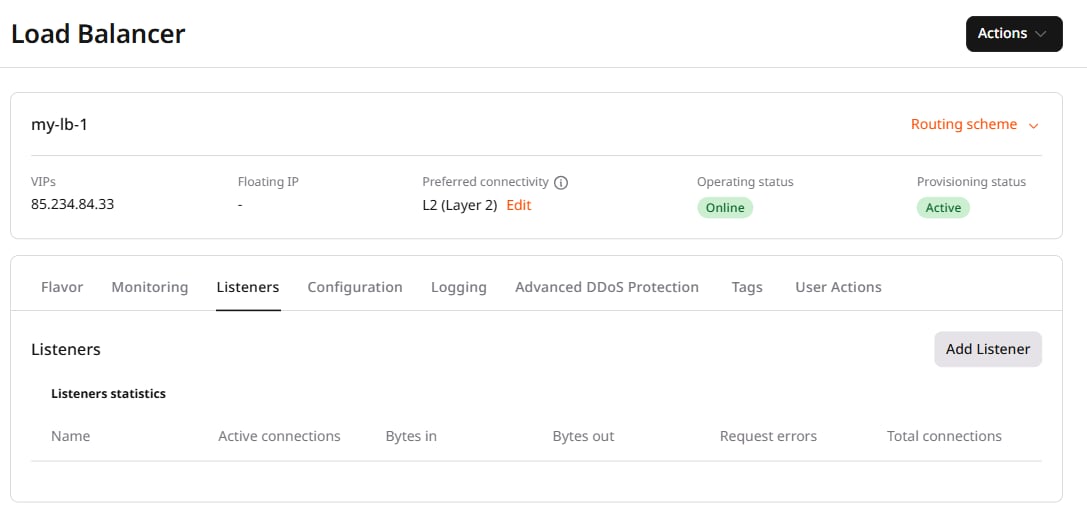
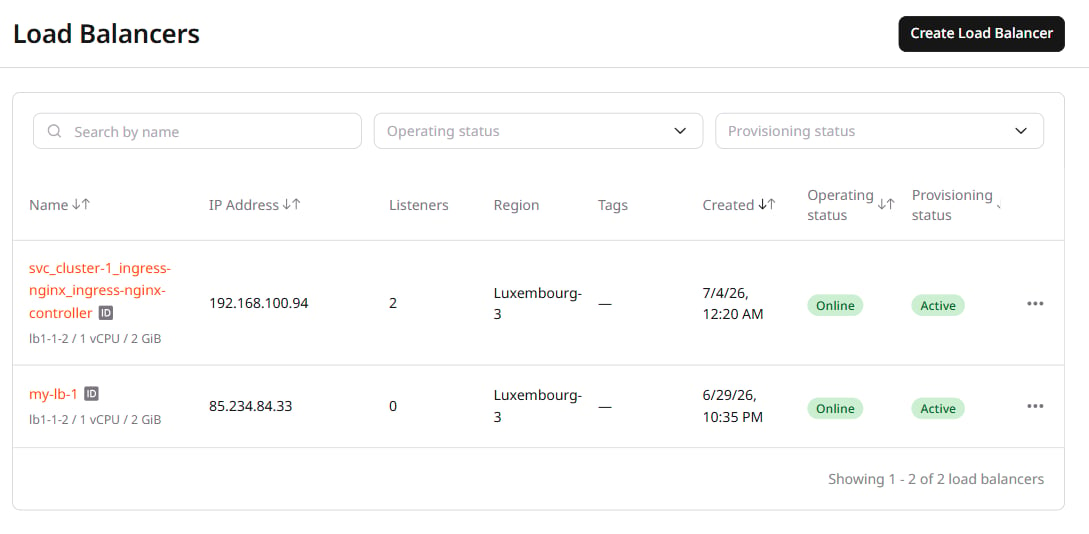 Select the **Listeners** tab and click **Add Listener**.
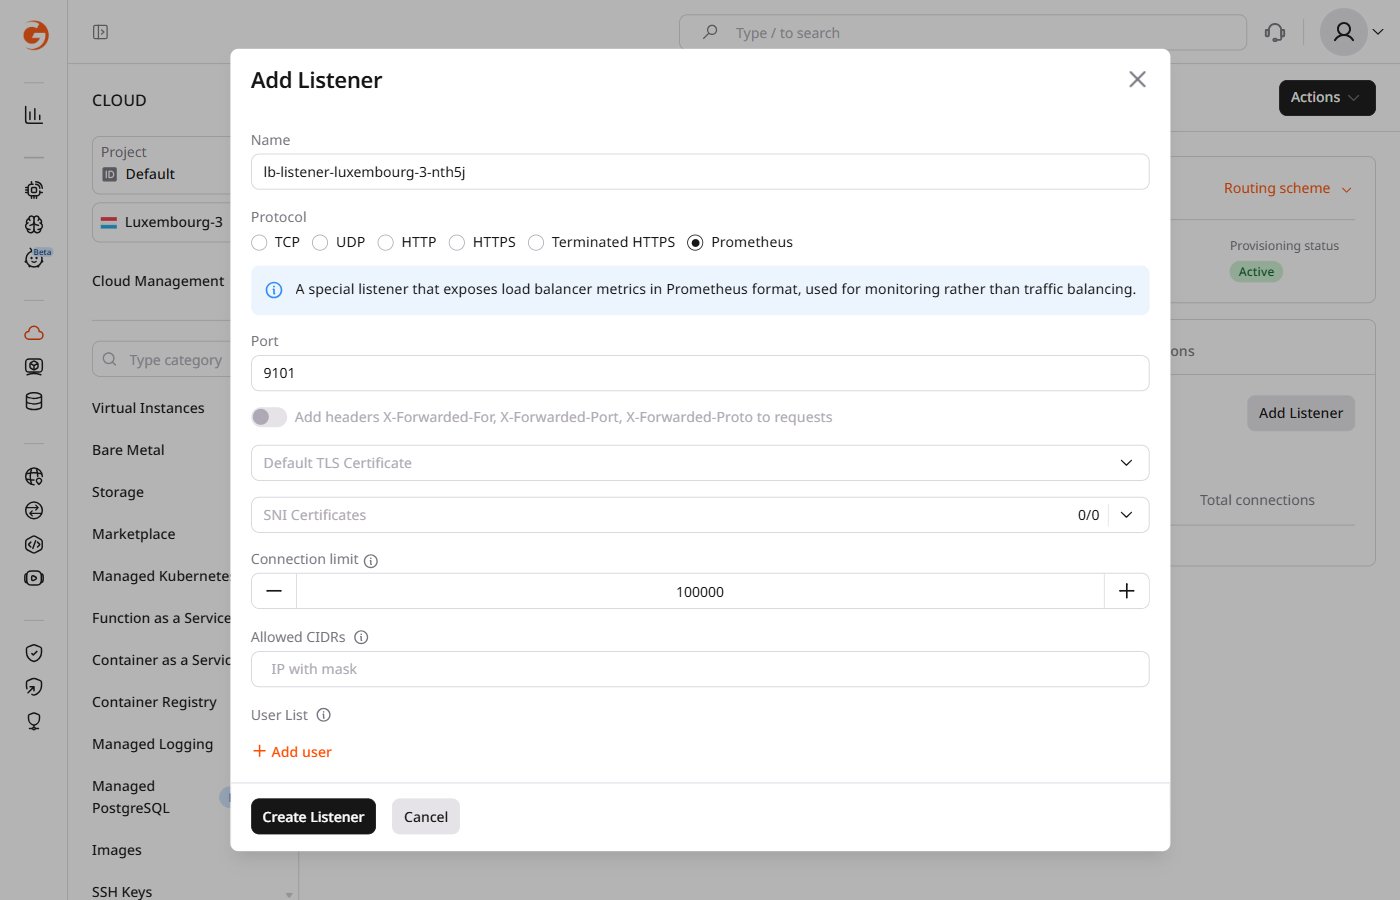
 Enter a **Name**, select **Prometheus** as the **Protocol**. The default port is `9101`. Set a **Connection limit** if needed.
The following options are available to secure the Prometheus listener:
* Define an allowed IP range with **Allowed CIDRs**.
* Define a list of users with access through **User List** (Basic Auth).
* Enable SSL/TLS by [adding certificates](/cloud/networking/load-balancers/add-certificates-to-load-balancer).
* Enable mTLS [via the Gcore Cloud API](/cloud/networking/load-balancers/configure-mtls-authentication).
Enter a **Name**, select **Prometheus** as the **Protocol**. The default port is `9101`. Set a **Connection limit** if needed.
The following options are available to secure the Prometheus listener:
* Define an allowed IP range with **Allowed CIDRs**.
* Define a list of users with access through **User List** (Basic Auth).
* Enable SSL/TLS by [adding certificates](/cloud/networking/load-balancers/add-certificates-to-load-balancer).
* Enable mTLS [via the Gcore Cloud API](/cloud/networking/load-balancers/configure-mtls-authentication).
 Click **Create Listener** and wait until the Prometheus listener appears in the list.
Add the listener as a target to a Prometheus instance by adding the following lines to `prometheus.yml` under `scrape_configs`:
```yaml theme={null}
- job_name:
metrics_path: /metrics
static_configs:
- targets:
- :
```
### Disable Prometheus listener
Before deleting a Prometheus listener, delete the corresponding job from all `prometheus.yml` files.
In the **Cloud** menu, select **Networking** and then **Load Balancers**. Click the Load Balancer name.
Select the **Listeners** tab, find the Prometheus listener, click the action menu on the right, and click **Delete**.
## Logging as a service
Load Balancers can forward listener access logs to Gcore Managed Logging (LaaS). Logs are stored in the destination region configured per Load Balancer.
### Enable logging
In the **Cloud** menu, select **Networking** and then **Load Balancers**. Click the Load Balancer name.
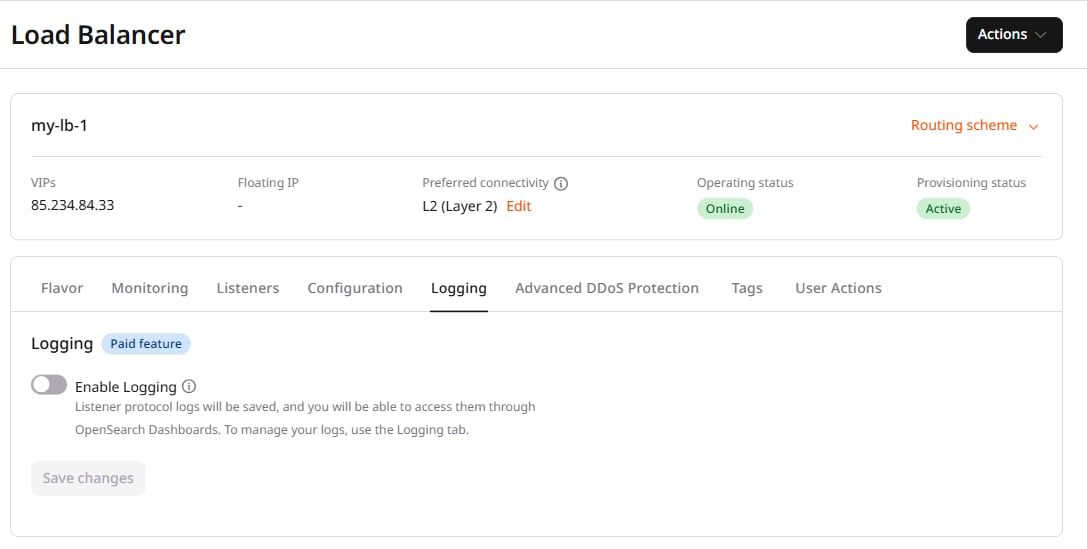
Select the **Logging** tab and activate the **Enable Logging** toggle.
Select a **Destination region**, then select an existing log **Topic** or create a new one and specify the **Retention** period. For full configuration details, see [Logging for load balancers](/cloud/networking/load-balancers/logging-for-load-balancers).
Click **Create Listener** and wait until the Prometheus listener appears in the list.
Add the listener as a target to a Prometheus instance by adding the following lines to `prometheus.yml` under `scrape_configs`:
```yaml theme={null}
- job_name:
metrics_path: /metrics
static_configs:
- targets:
- :
```
### Disable Prometheus listener
Before deleting a Prometheus listener, delete the corresponding job from all `prometheus.yml` files.
In the **Cloud** menu, select **Networking** and then **Load Balancers**. Click the Load Balancer name.
Select the **Listeners** tab, find the Prometheus listener, click the action menu on the right, and click **Delete**.
## Logging as a service
Load Balancers can forward listener access logs to Gcore Managed Logging (LaaS). Logs are stored in the destination region configured per Load Balancer.
### Enable logging
In the **Cloud** menu, select **Networking** and then **Load Balancers**. Click the Load Balancer name.
Select the **Logging** tab and activate the **Enable Logging** toggle.
Select a **Destination region**, then select an existing log **Topic** or create a new one and specify the **Retention** period. For full configuration details, see [Logging for load balancers](/cloud/networking/load-balancers/logging-for-load-balancers).
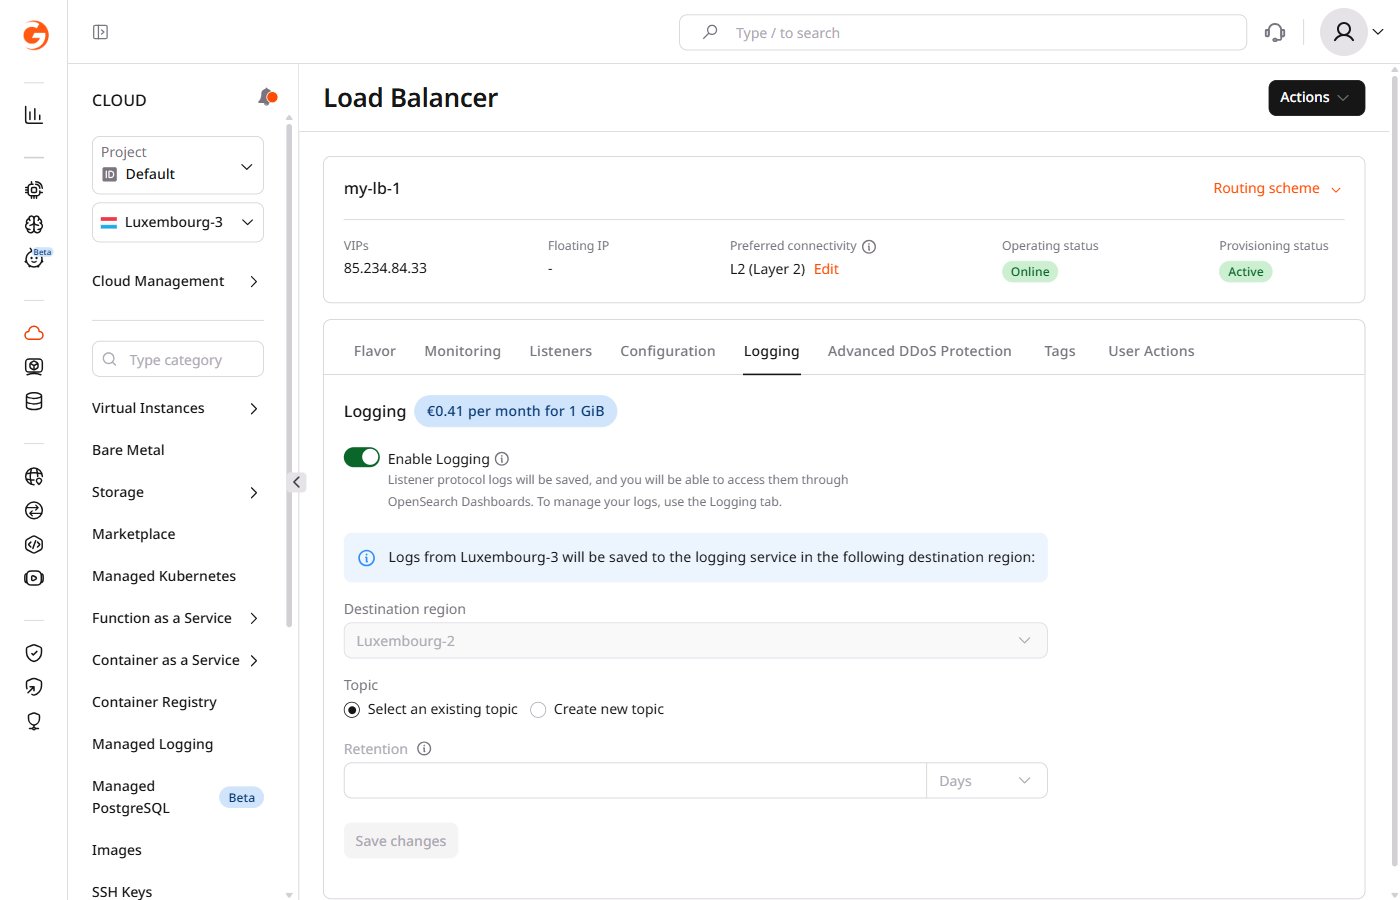 Click **Save changes**. The Logging service begins collecting logs for the Load Balancer.
### View the logs
Logs are accessible in the Customer Portal or in [a Grafana instance](/cloud/logging-as-a-service/view-opensearch-logs-in-Grafana).
In the **Cloud** menu, select **Managed Logging**.
Click **Save changes**. The Logging service begins collecting logs for the Load Balancer.
### View the logs
Logs are accessible in the Customer Portal or in [a Grafana instance](/cloud/logging-as-a-service/view-opensearch-logs-in-Grafana).
In the **Cloud** menu, select **Managed Logging**.
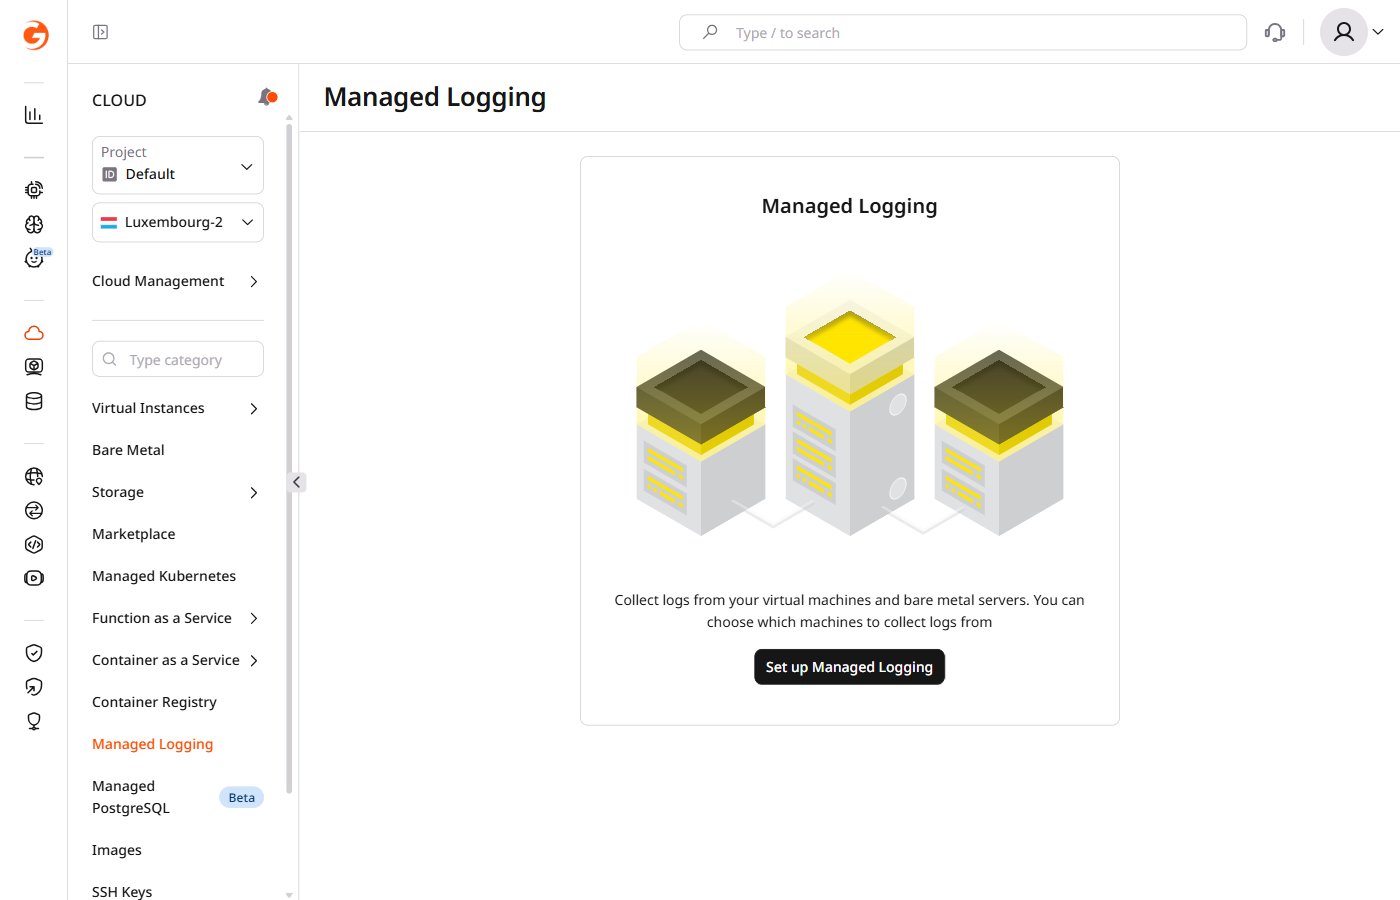 Select a log topic from the list and click the corresponding **View Logs** link.
### Disable logging
In the **Cloud** menu, select **Networking** and then **Load Balancers**. Click the Load Balancer name.
Select the **Logging** tab, deactivate the **Enable Logging** toggle, and click **Save changes**.
Select a log topic from the list and click the corresponding **View Logs** link.
### Disable logging
In the **Cloud** menu, select **Networking** and then **Load Balancers**. Click the Load Balancer name.
Select the **Logging** tab, deactivate the **Enable Logging** toggle, and click **Save changes**.
 ## Cloud API endpoints
Status, metrics, and general statistics for Load Balancers are available via the Gcore Cloud API.
### Load Balancer status
The status endpoints return the operating and provisioning status of a Load Balancer, its listeners, and their pools. Request [one Load Balancer's status](/api-reference/cloud#tag/Load-Balancers/operation/LoadBalancerStatusInstanceViewSet.get) or [status for all Load Balancers](/api-reference/cloud#tag/Load-Balancers/operation/LoadBalancerStatusViewSet.get).
### Load Balancer metrics
The [metrics endpoint](/api-reference/cloud#tag/Load-Balancers/operation/LoadbalancerMetricsHandler.post) returns CPU, memory, and network utilization data for the Load Balancer.
### Load Balancer and listener statistics
Request statistics by calling the GET endpoint with `?show_stats=true`: [one Load Balancer](/api-reference/cloud#tag/Load-Balancers/operation/LoadBalancerInstanceViewSet.get), [one listener](/api-reference/cloud#tag/Load-Balancers/operation/LoadBalancerListenerInstanceViewSet.get), or [all listeners](/api-reference/cloud#tag/Load-Balancers/operation/LoadBalancerListenerViewSet.get).
## Cloud API endpoints
Status, metrics, and general statistics for Load Balancers are available via the Gcore Cloud API.
### Load Balancer status
The status endpoints return the operating and provisioning status of a Load Balancer, its listeners, and their pools. Request [one Load Balancer's status](/api-reference/cloud#tag/Load-Balancers/operation/LoadBalancerStatusInstanceViewSet.get) or [status for all Load Balancers](/api-reference/cloud#tag/Load-Balancers/operation/LoadBalancerStatusViewSet.get).
### Load Balancer metrics
The [metrics endpoint](/api-reference/cloud#tag/Load-Balancers/operation/LoadbalancerMetricsHandler.post) returns CPU, memory, and network utilization data for the Load Balancer.
### Load Balancer and listener statistics
Request statistics by calling the GET endpoint with `?show_stats=true`: [one Load Balancer](/api-reference/cloud#tag/Load-Balancers/operation/LoadBalancerInstanceViewSet.get), [one listener](/api-reference/cloud#tag/Load-Balancers/operation/LoadBalancerListenerInstanceViewSet.get), or [all listeners](/api-reference/cloud#tag/Load-Balancers/operation/LoadBalancerListenerViewSet.get).