

Prometheus listener
A Prometheus listener exposes an endpoint with the Load Balancer’s metrics for scraping with Prometheus and viewing with Grafana. Unlike regular balancing listeners, it does not route traffic — it only serves metrics.Enable Prometheus listener
1
Open the Load Balancer settings
In the Cloud menu, select Networking and then Load Balancers. Click the Load Balancer name to open its settings.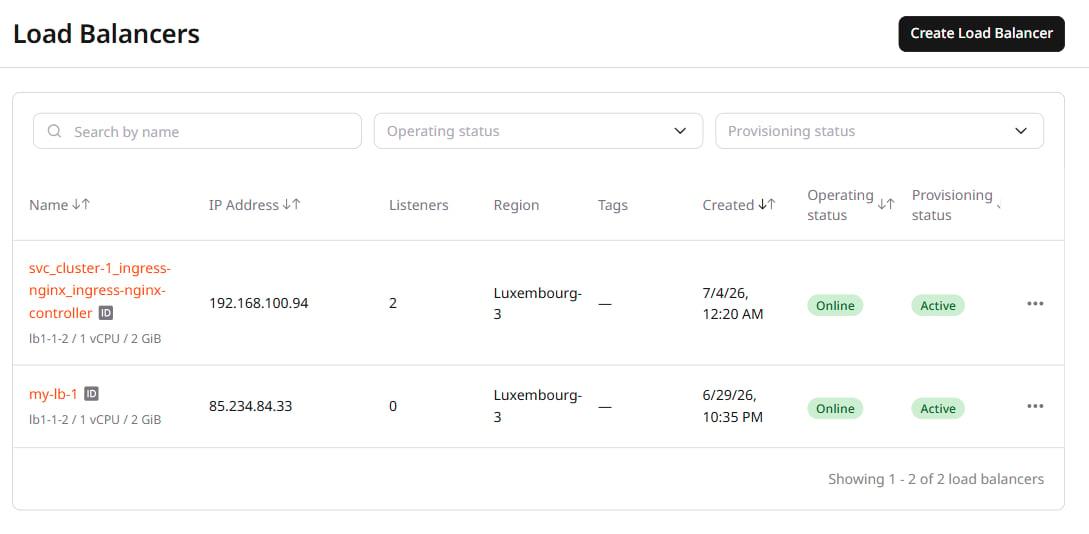
2
Open the Listeners tab
Select the Listeners tab and click Add Listener.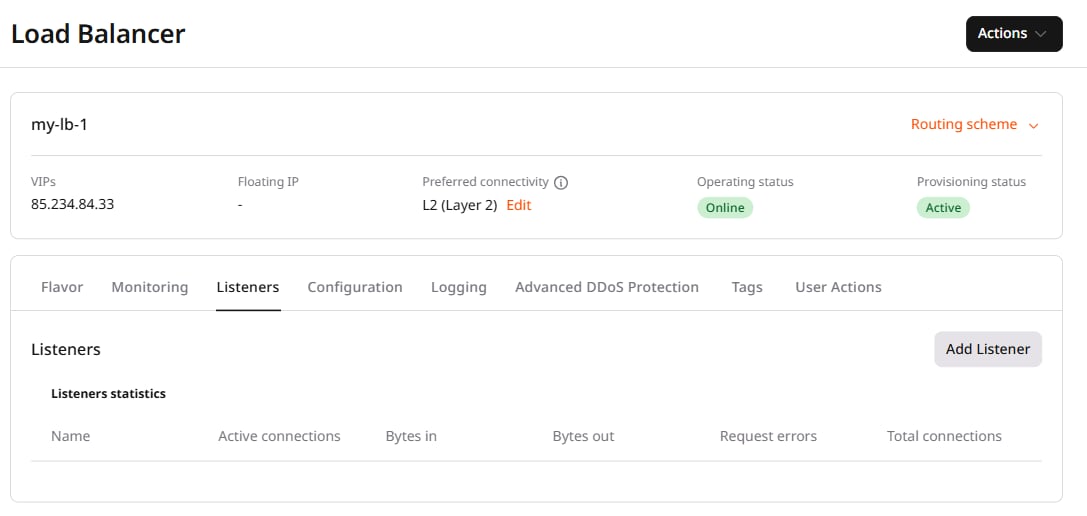
3
Configure the listener
Enter a Name, select Prometheus as the Protocol. The default port is 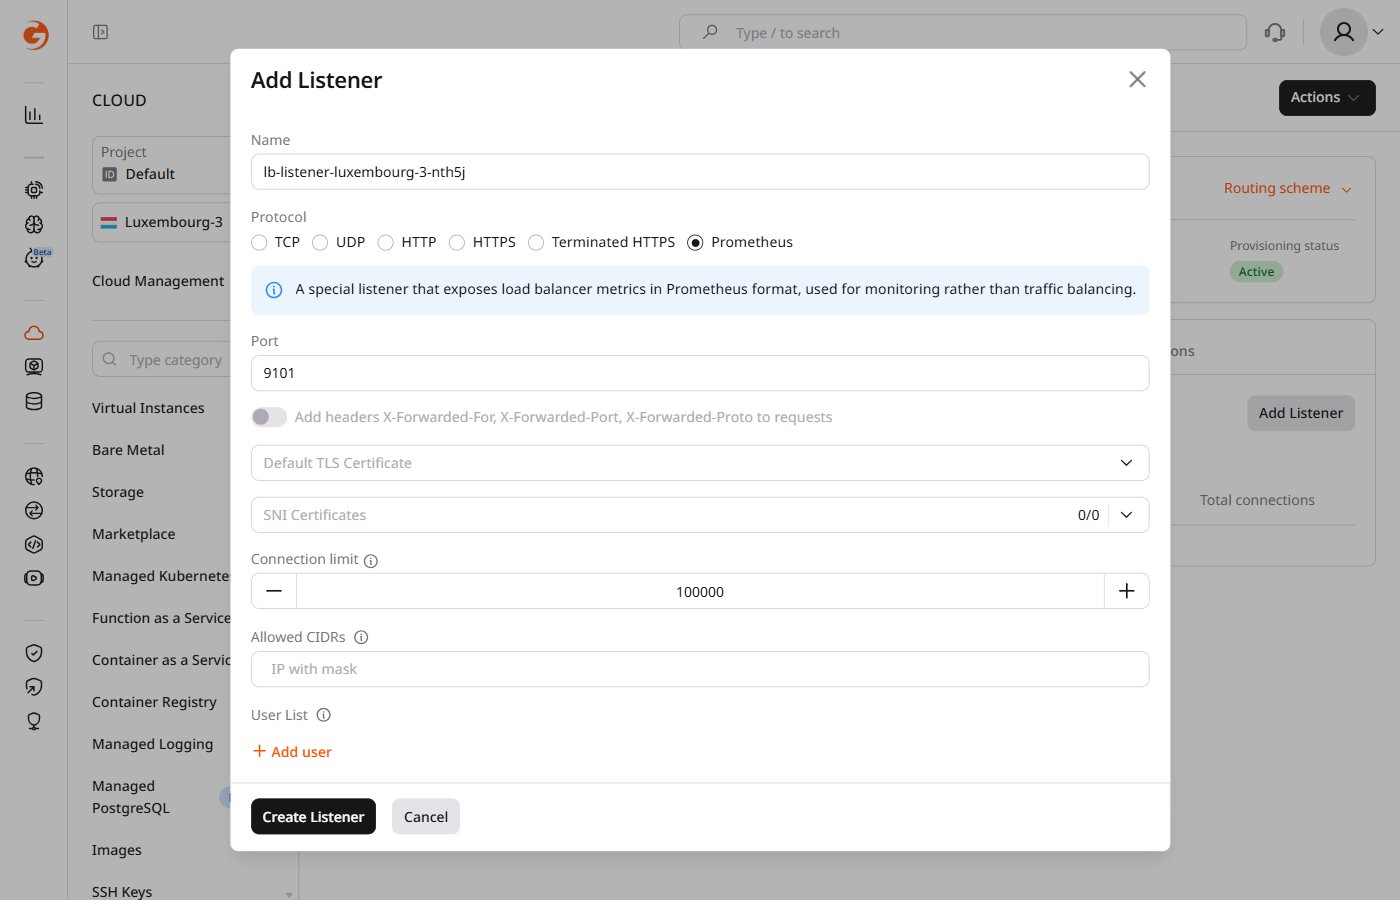
9101. Set a Connection limit if needed.The following options are available to secure the Prometheus listener:- Define an allowed IP range with Allowed CIDRs.
- Define a list of users with access through User List (Basic Auth).
- Enable SSL/TLS by adding certificates.
- Enable mTLS via the Gcore Cloud API.
4
Create the listener
Click Create Listener and wait until the Prometheus listener appears in the list.Add the listener as a target to a Prometheus instance by adding the following lines to
prometheus.yml under scrape_configs:Disable Prometheus listener
Before deleting a Prometheus listener, delete the corresponding job from all
prometheus.yml files.1
Open the Load Balancer settings
In the Cloud menu, select Networking and then Load Balancers. Click the Load Balancer name.
2
Delete the listener
Select the Listeners tab, find the Prometheus listener, click the action menu on the right, and click Delete.
Logging as a service
Load Balancers can forward listener access logs to Gcore Managed Logging (LaaS). Logs are stored in the destination region configured per Load Balancer.Enable logging
1
Open the Load Balancer settings
In the Cloud menu, select Networking and then Load Balancers. Click the Load Balancer name.
2
Configure logging
Select the Logging tab and activate the Enable Logging toggle.Select a Destination region, then select an existing log Topic or create a new one and specify the Retention period. For full configuration details, see Logging for load balancers.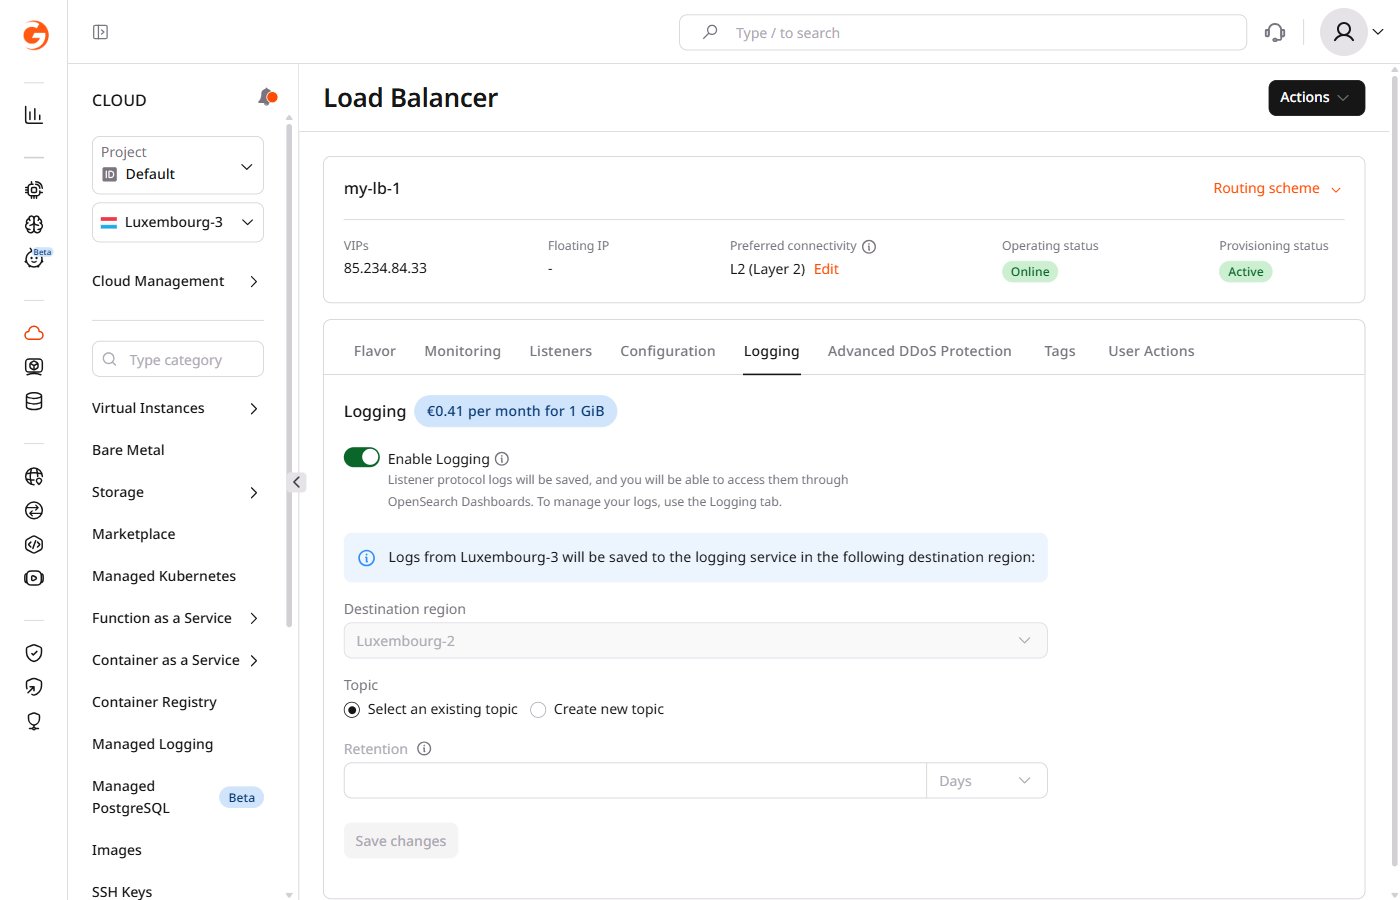
3
Save
Click Save changes. The Logging service begins collecting logs for the Load Balancer.
View the logs
Logs are accessible in the Customer Portal or in a Grafana instance.1
Open Managed Logging
In the Cloud menu, select Managed Logging.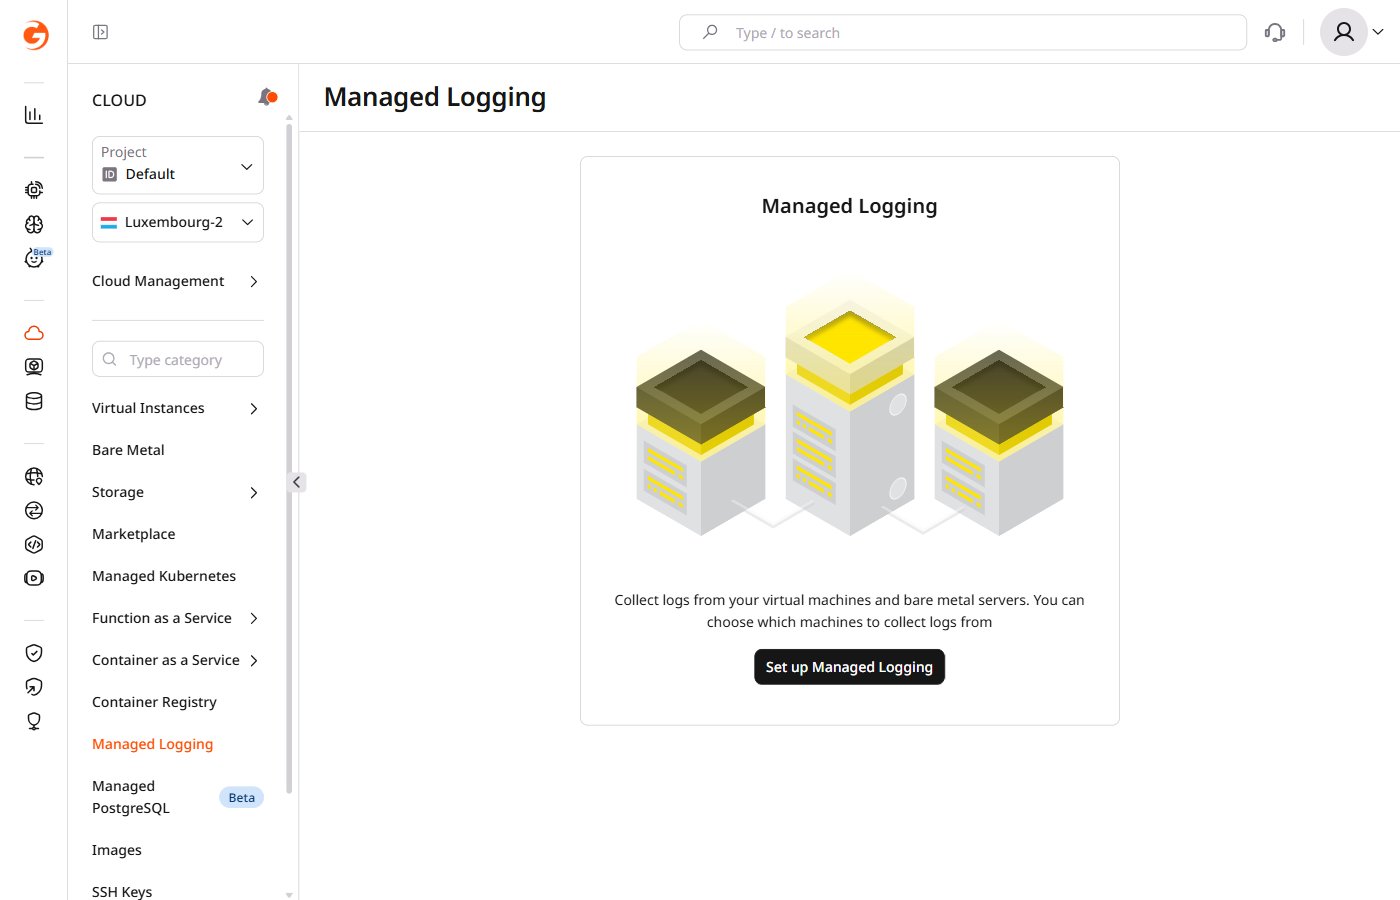
2
Open the OpenSearch dashboard
Select a log topic from the list and click the corresponding View Logs link.
Disable logging
1
Open the Load Balancer settings
In the Cloud menu, select Networking and then Load Balancers. Click the Load Balancer name.
2
Deactivate logging
Select the Logging tab, deactivate the Enable Logging toggle, and click Save changes.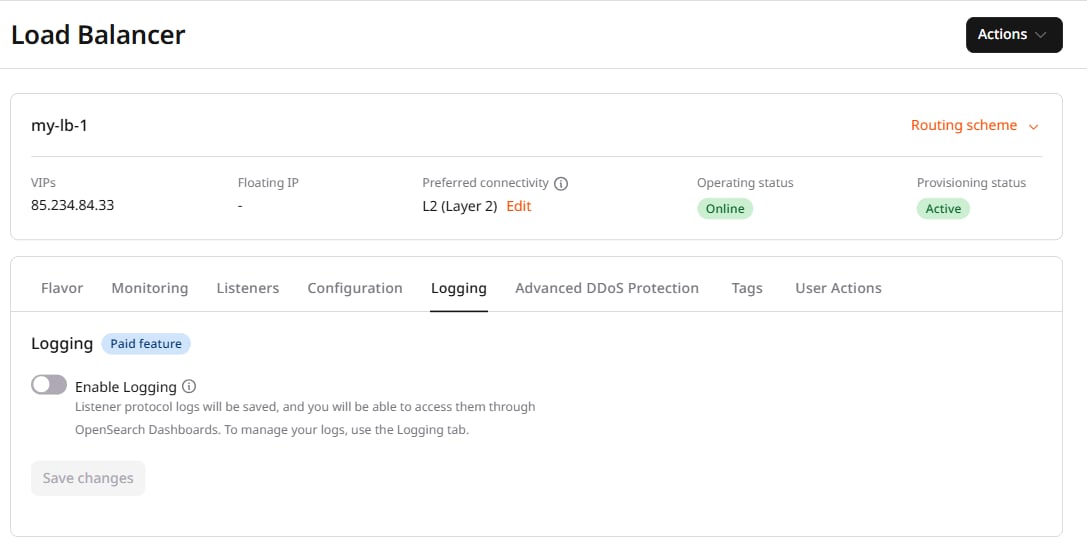
Cloud API endpoints
Status, metrics, and general statistics for Load Balancers are available via the Gcore Cloud API.Load Balancer status
The status endpoints return the operating and provisioning status of a Load Balancer, its listeners, and their pools. Request one Load Balancer’s status or status for all Load Balancers.Load Balancer metrics
The metrics endpoint returns CPU, memory, and network utilization data for the Load Balancer.Load Balancer and listener statistics
Request statistics by calling the GET endpoint with?show_stats=true: one Load Balancer, one listener, or all listeners.